
Take the Sting Out of Payer Negotiations
Your managed care team knows what your hospital is paid. What it hasn't had is a clear view of how that reimbursement compares across your state. Vitality Payer Scorecard™ is the compass: it shows how payers perform. Honee™ is the GPS: individual analytics that pinpoint your hospital's position in your state, built on de-identified claims and remits that are anonymized, aggregated at the state level, and 90 days old.

You know what you're paid.
Now see where you stand in the state.
Most hospitals walk into payer negotiations with their own contract history and not much else. Without a view of reimbursement in your state, your team ends up reacting to the payer's numbers instead of bringing your own. Honee™ closes that gap with state-level analytics built for your hospital, so you know where each payer and each procedure stands before the conversation starts.

Your Compass + Your GPS
Vitality Payer Scorecard™ gives you direction.
Honee™ gives you position.
Use them together. One tells you where to look. The other tells you where you are.
Your Compass: Vitality Payer Scorecard™
How payers perform. See which payers need attention at your hospital: who pays slowly, who denies more often, and how payer behavior is trending. It's the view your revenue cycle team and CFO use to spot problems early and hold payers accountable.

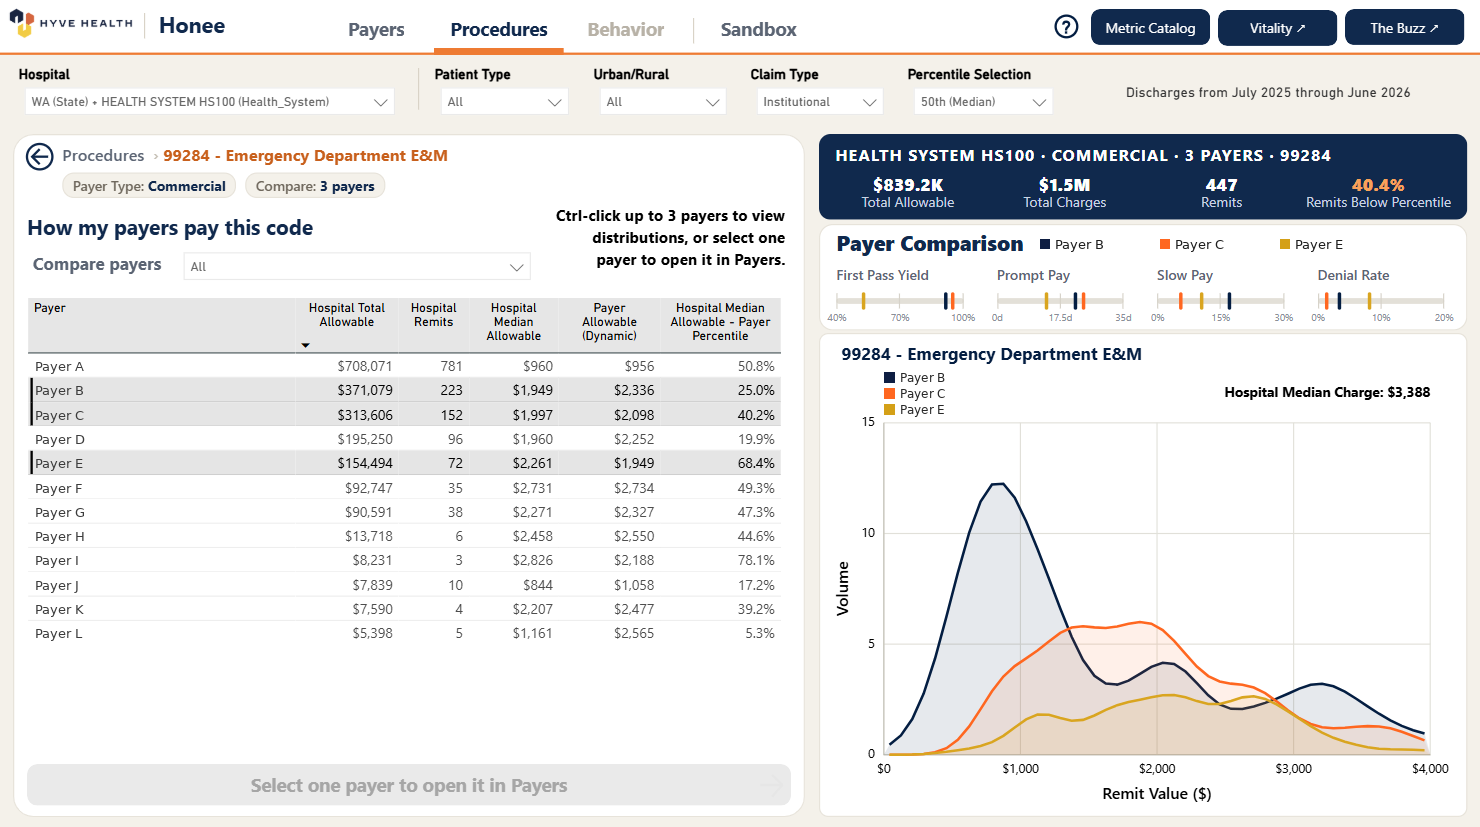
Your GPS: Honee™
Where you stand. See where your reimbursement stands when it's time to talk terms, payer by payer and procedure by procedure, compared to your state. Built for the managed care and contracting teams heading into the next negotiation.
Questions you can answer
Every view starts at your hospital and stays there. You see your payers, your procedures, and your claims, compared to anonymized, aggregated state-level data.
Evaluate your payers
See your payers' volume, dollars, and reimbursement trends at your hospital.
- Which payers drive the most volume and dollars at my hospital?
- How has reimbursement from each of my payers shifted over time?
- How does each payer's reimbursement at my hospital compare to my other payers?
- Which payers reimburse above or below my hospital's trends?
- Which payers should I focus on when negotiating contracts?
See where you stand in your state
Analyze your hospital's reimbursement compared to the state.
- Does my reimbursement align with what payers pay in my state?
- Which of my procedures show the largest gap from state percentiles?
- Where does my hospital fall within state percentiles for a given procedure?
- How does my hospital's position in my state vary by payer or procedure?
- Has my hospital's reimbursement position in my state changed over time?
- How does my payers' performance at my hospital compare to my state?
Focus on your procedures
Drill down to any of your procedures, payer by payer, with state-level analytics.
- How does my reimbursement for a procedure vary across payers?
- How does payer behavior change at the procedure level?
- How does reimbursement for a procedure at my hospital compare to state trends?
- Which payers reimburse my hospital above or below the state for a specific procedure?
Analyze your payer behavior
Compare how payers treat your hospital's claims with state-level analytics.
- Where do my denial rates stand compared to my state?
- Which payers downcode my procedures more often than the state average?
- How do payers treat my hospital's claims compared to my state?
- How does payer behavior vary across my highest-dollar procedures?
From payer to procedure in a few clicks.
Understand your hospital's position in your state, procedure by procedure. Negotiate with state-level analytics.
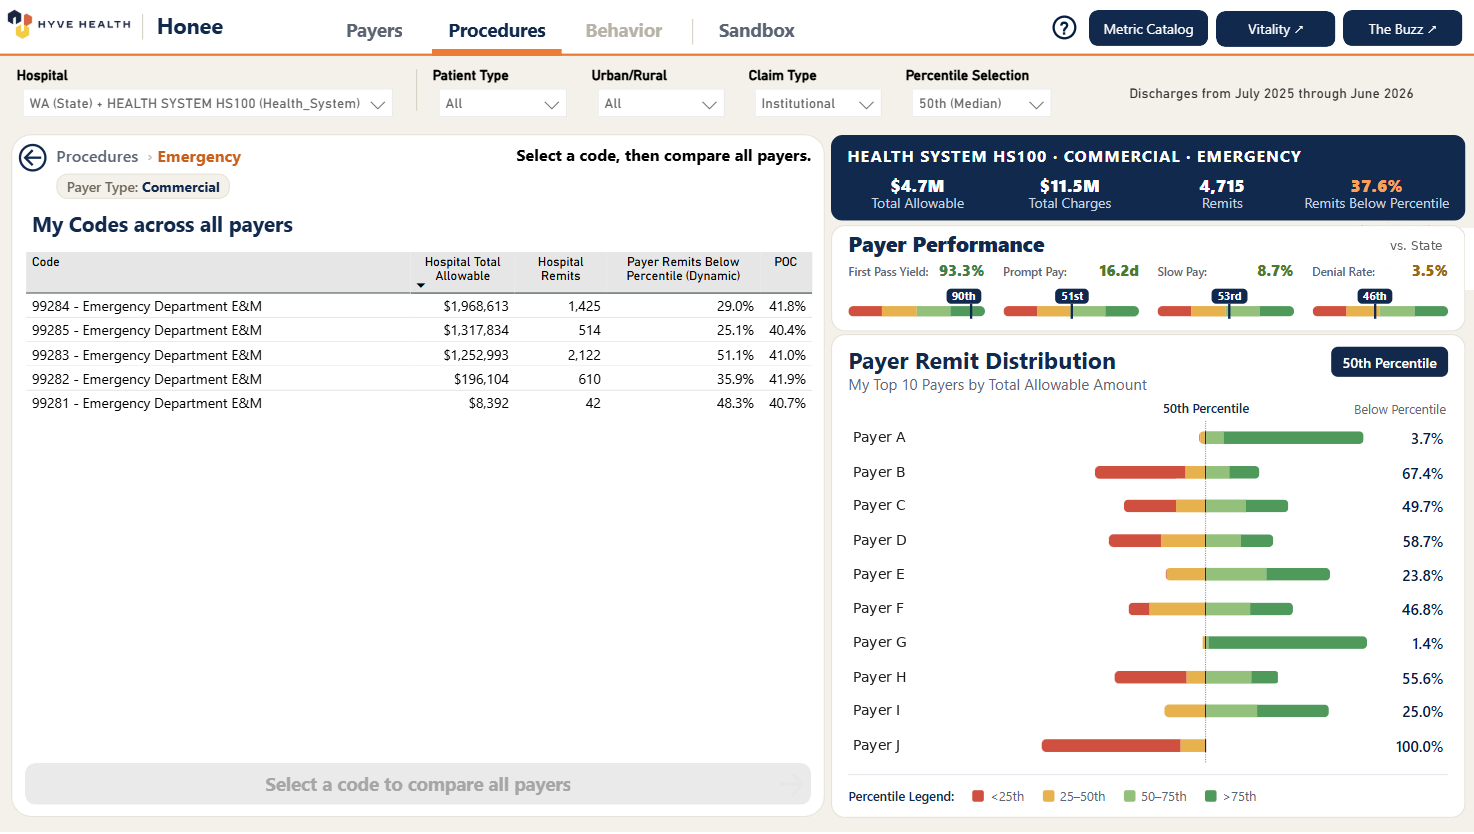
1. Evaluate your payers
Start with the full picture at your hospital: volume, reimbursement, and trends for every payer, compared to the state. See which payers carry the most weight and where reimbursement has moved.
2. Drill into your procedure detail
Pick a payer and go straight to the procedures behind the numbers. Analyze volume, reimbursement, and payer behavior at the procedure level, including denials and prompt pay.
3. Compare your procedures across the state
See how each procedure is reimbursed across your payers and where it falls against state percentiles. Find the gaps worth bringing to the table.
Built for the teams at the table
Managed care and contracting
Prepare for negotiations with state-level analytics on every payer and procedure.
CFO and finance
Understand reimbursement at your hospital by payer, by procedure, and over time.
Revenue cycle
Connect payer behavior like denials, downcoding, and slow pay to what your hospital is actually reimbursed.
Negotiations Backed by Facts
Honee™ runs on the same 837 claims and 835 remits your hospital already produces. Patient information is de-identified before it reaches Hyve Health, and every state comparison uses anonymized, aggregated data that is 90 days old, refreshed monthly. Analysis is always individual to your hospital.
Individual hospital analytics · Anonymized, aggregated state-level data · 90 days old · Built on 837 claims and 835 remits
Already on Vitality Payer Scorecard™?
Turning on Honee™ is like flipping a switch. No install, no new data or files: it runs on the same claims and remits your hospital already sends us. Honee™ is a paid add-on, so reach out to us to get started.
Your demo doesn't have to run on sample data. Because Honee™ runs on the claims and remits your hospital already sends us, we can walk you through real examples from your hospital: your payers, your procedures, and where you stand in your state.
Request a demo with your dataNew to Hyve Health?
Getting started is simple, and a light lift for your team. Honee™ implementation is the same as a Vitality Payer Scorecard™ implementation:
It runs on your side, so no PHI reaches Hyve Health.
Two years of 837 claim and 835 remit files. No custom data extractions.
Less than one week of your team's time to implement. Many hospitals are onboarded and looking at their dashboards within two months.
Common questions
What data does Honee™ use?
Your hospital's de-identified 837 claims and 835 remits, compared to anonymized, aggregated data at the state level.
Can anyone see my hospital's data?
No. Your data is de-identified and only appears in state comparisons as anonymized, aggregated data. Your analytics are yours.
How current is it?
State-level data is 90 days old and refreshed monthly.
Do I need Vitality Payer Scorecard™?
No. If you're already on Vitality Payer Scorecard™, Honee™ is a paid add-on. Just reach out to us to turn it on. If you're new to Hyve Health, getting started works the same way it does for Vitality Payer Scorecard™.